Home Energy Grafana

Grafana is one of our go to tools for data exploration at work. Since we are storing lots of data in InfluxDB it is a simple way to create quick dashboards. This week I found myself using it to explore how much energy we were generating via our house solar and trying to work out what was contributing to our base load. The image above shows our daily gas usage over the past 2 weeks (16-19th Feb were warmer days so less heating used).
I ended up collating several different energy meters that I had been looking at in several different places into one dashboard. Some initial observations.
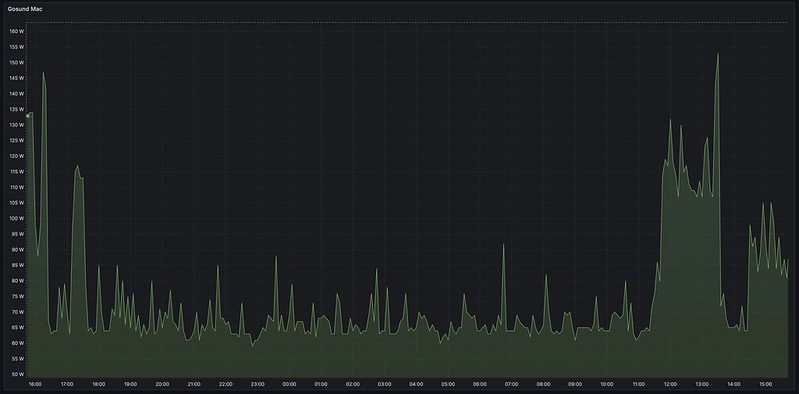
The house Mac tends to be left on 24/7 since it is used on a daily basis (and is set to back up overnight) but I hadn’t appreciated how much energy it was using (although after switching it off overnight it looks like I have other devices also on that socket! Will investigate…)

Daily Electricity Usage (middle left chart above). Showering is a significant contributor (ie we don’t all manage the sub 4 minute guidance). The base load seems to around around 500W

Daily totals of energy use and solar generation. Solar panels have generated almost 8 Megawatt-Hours since Nov 2018.
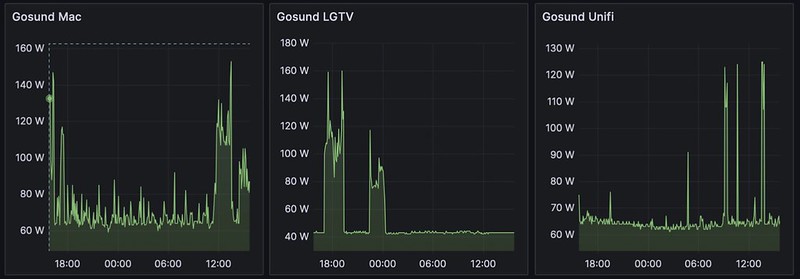
Some standby modes still use a reasonable amount of energy - so worth, for example, turning the TV off at the mains.


Is nice to see that at some times of day in the summer months we are generating more than we are comsuming which means we are feeding back into the grid.
Am going to make some changes and revisit the data in a month.