House Mill flood monitoring
 House Mill Sonar
About six months ago I received an email from a colleague at the Institute of Archeology who has been volunteering at House Mill. He was keen to explore how technology might help them monitor flood events to build an evidence base to support future flood mitigation activity.
Built in 1776, the House Mill is the world’s largest surviving tidal mill and is on a site that has a fantastic history of milling including making gunpowder for the Spanish Armada to jumping on the Gin Craze in the 18th century.
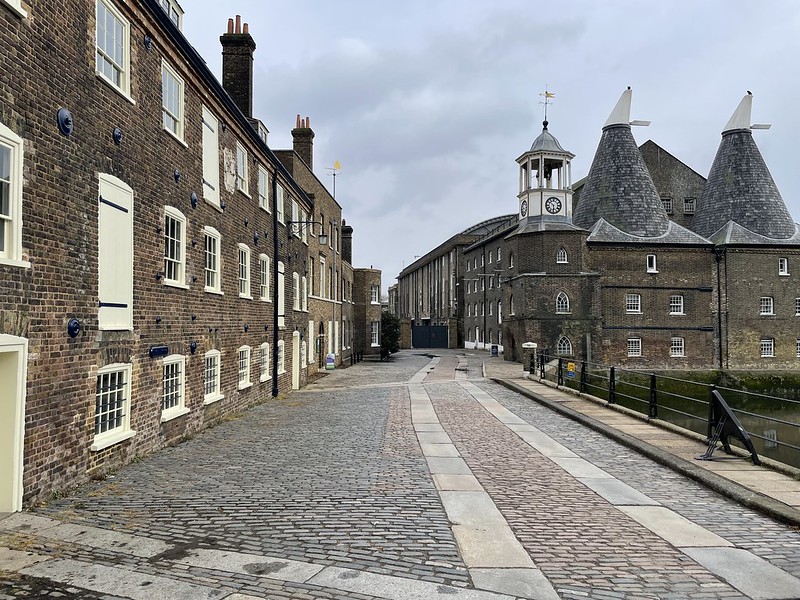 House Mill
The Grade 1 listed building ceased milling in 1941 and was saved from demolition (and site being turned into a car park) in the 70’s. The House Mill trust has received generous support from several organisations, including English Heritage, for the partial restoration of the House Mill. This work continues with a small team of volunteers.
Since June we have been monitoring water height under the mill to build up a picture of how often the combination of water flowing down the River Lea plus the incoming spring tides from the River Thames cause the wooden beams and floorboards to become submerged in water. Whilst anecdotal evidence of these events had been captured they were mostly based on observations of the aftermath since the floods can happen at any time of day or night and the site is not occupied 24/7. Our goal was to use Internet of Things technology to explore how a continuous monitoring strategy could help inform flood observations.
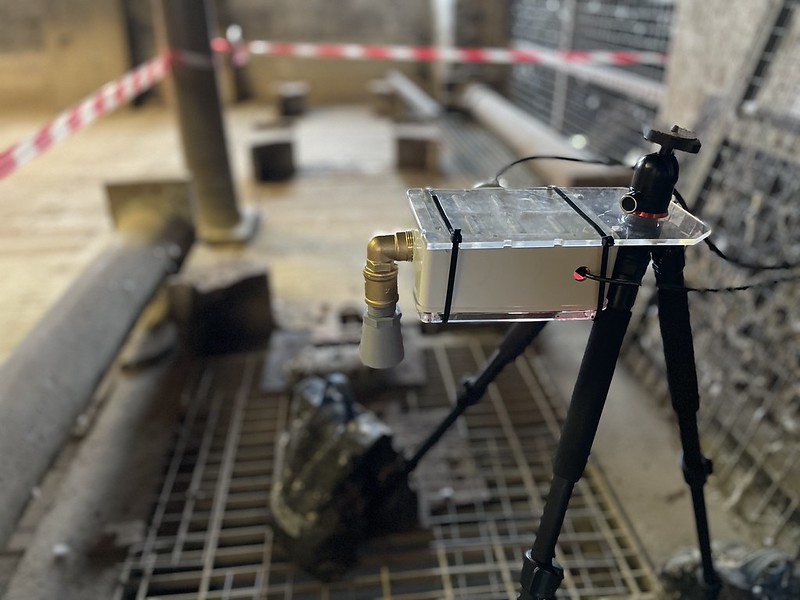
The image below shows the set-up we used. A Raspberry Pi, a Maxbotix MB7389 sonar sensor (5m range) plus a RPi Camera to create timelapse footage. The original intention was to connect via Lora but our gateway in the nearby Orbit was just out of range - so a back using 4G was implemented. We used triggers to turn on the timelapse and had some seperate scripts running to store tide times. All code is on GitHub.
 House Mill Sonar Box
The video below shows footage of flooding at House Mill on 3rd August 2023. We had seen notifications from the flood sensor the previous night showing the Mill had flooded so we called back during the day at the next high tide to supplement the timelapse footage with some iPhone footage. It was amazing how quickly the water comes up through the floor boards.
iPhone footage of House Mill - 3Aug23 from Duncan Wilson on Vimeo.
Timelapse footage August 2023
Live and historic data is avaialble on a public Grafana site:

The first round of analysis has just been completed with some recalculations to add in beam height. Initially we were just recording events when the water came above the floorboards. In reality we are interested in all the wood below the floorboard level (ie the wooden beams). The yellow and blue dotted lines in the dashboard above show the zone we are interested in. Doing some calculations for August and September it looks like the beams / floor were under water for 10 hours in August and 13 hours in September.
The next step is to automate the “time under water” metric which will require some further work to remove the noise in sensor readings at low tide - but am working to fix that.
Project images continue to be added to Flickr:
